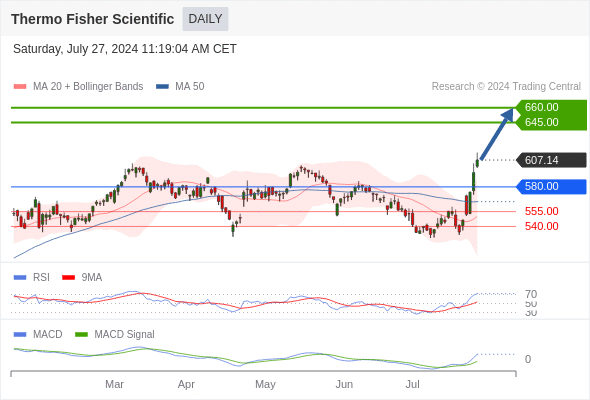
Our pivot point stands at 580.
Our preference
The upside prevails as long as 580 is support.
Alternative scenario
Below 580, expect 555 and 540.
Comment
The RSI is trading above 70. This could mean that either the stock is in a lasting uptrend or just overbought and that therefore a correction could shape (look for bearish divergence in this case). The MACD is above its signal line and positive. The configuration is positive. Moreover, the stock is trading above both its 20 and 50 day moving average (respectively at 550.266 and 565.1002). Finally, Thermo Fisher Scientific is trading above its upper Bollinger band (standing at 590.47).
Supports and resistances
690 **
676 *
660 **
645
607.14 (USD-last)
590
580 **
555 *
540 **
Number of asterisks represents the strength of support and resistance levels.