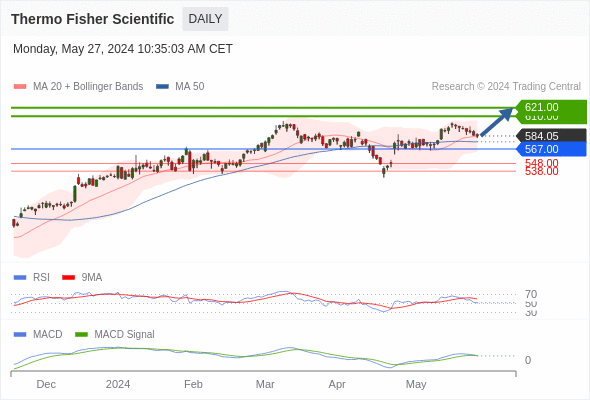
Our pivot point is at 567.
Our preference
As long as 567 is support look for 621.
Alternative scenario
The downside breakout of 567 would call for 548 and 538.
Comment
The RSI is above 50. The MACD is positive and below its signal line. The stock could retrace in the short term. Moreover, the stock is trading above both its 20 and 50 day moving average (respectively at 583.8115 and 576.4326).
Supports and resistances
643 **
632 *
621 **
610
584.05 (USD-last)
574
567 **
548 *
538 **
Number of asterisks represents the strength of support and resistance levels.