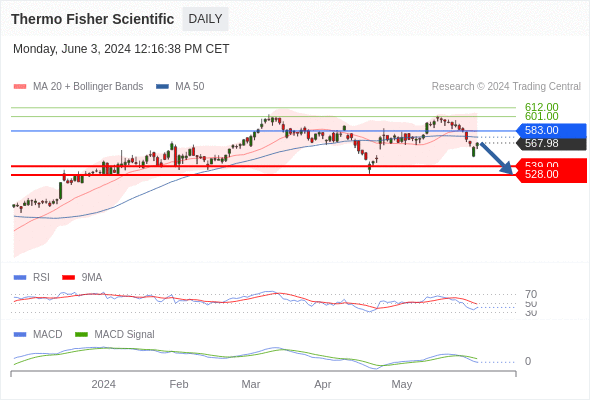
Our pivot point is at 583.
Our preference
The downside prevails as long as 583 is resistance.
Alternative scenario
The upside breakout of 583 would call for 601 and 612.
Comment
The RSI is below its neutrality area at 50. The MACD is below its signal line and negative. The configuration is negative. Moreover, the stock is trading under both its 20 and 50 day moving average (respectively at 582.7495 and 575.3054).
Supports and resistances
612 **
601 *
583 **
576
567.98 (USD-last)
539
528 **
518 *
507 **
Number of asterisks represents the strength of support and resistance levels.