

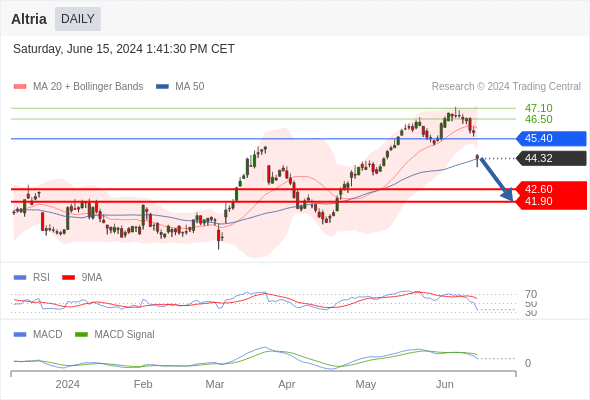
Our pivot point is at 45.4.
Our preference
Target 41.9.
Alternative scenario
Above 45.4, look for 46.5 and 47.1.
Comment
The RSI is below its neutrality area at 50. The MACD is below its signal line and positive. The MACD must penetrate its zero line to expect further downside. Moreover, the stock is below its 20 day moving average (46.0175) but above its 50 day moving average (44.286). Finally, Altria has penetrated its lower daily Bollinger band (44.75).
Supports and resistances
47.1 **
46.5 *
45.4 **
45
44.32 (USD-last)
42.6
41.9 **
41.3 *
40.6 **
Number of asterisks represents the strength of support and resistance levels.