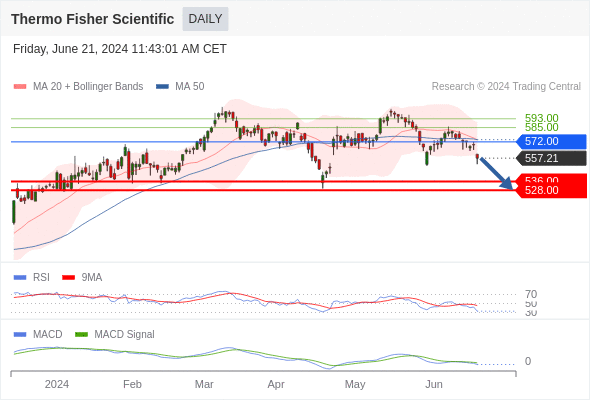
Our pivot point stands at 572.
Our preference
The downside prevails as long as 572 is resistance.
Alternative scenario
Above 572, look for 585 and 593.
Comment
The RSI is below 50. The MACD is negative and below its signal line. The configuration is negative. Moreover, the share stands below its 20 and 50 day moving average (respectively at 573.9035 and 573.9918). Finally, Thermo Fisher Scientific is trading below its lower daily Bollinger band (standing at 557.7).
Supports and resistances
593 **
585 *
572 **
566
557.21 (USD-last)
536
528 **
520 *
513 **
Number of asterisks represents the strength of support and resistance levels.